
Erasing Market Barriers
Unifying complex utility municipalities into a single digital customer experience
The Challenge
Client’s utility reach included six states with various regulatory policies in both residential and business (non-residential) sectors. They had acquired and merged another utility business and at the time had two web sites with fragmented content and structure. Customers were commonly confused by regulated and non-regulated content within state/municipal regions. There was also significant confusion between the sites on product availability and marketing offers available to them. Product offering were highly confusing in the business sector of their website since small business and larger enterprises had no structure to the various business goals.
Duke Energy Marketing Director
“We are challenged to find a balance between meeting heavily regulated municipality service contracts while serving a better customer experience.”
Business Goals
- S. Santos, Group Design Director, Accenture/Fjord Design and Innovation
“From the outset, Josh took charge of the engagement, developed a positive and collaborative relationship with the main client and business stakeholders. He was able to independently set the tone and cadence of the project; establishing and adhering to a detailed project plan that included user research and analysis (card sort) and Site Map development.”
Approach
Stakeholder Interviews
Identify Personas within customer segmentations
Content Audit
Marketing and Metrics Audit
Card Sort prep, polling
Card Sort Quantitative Analysis
Site Map (Preliminary IA) and stakeholder socialization
Wireframes with stakeholder alignment
Navigation Models and feedback
Finalize Site Map
Finalize Wireframes and socialize
Research Approach
Approach
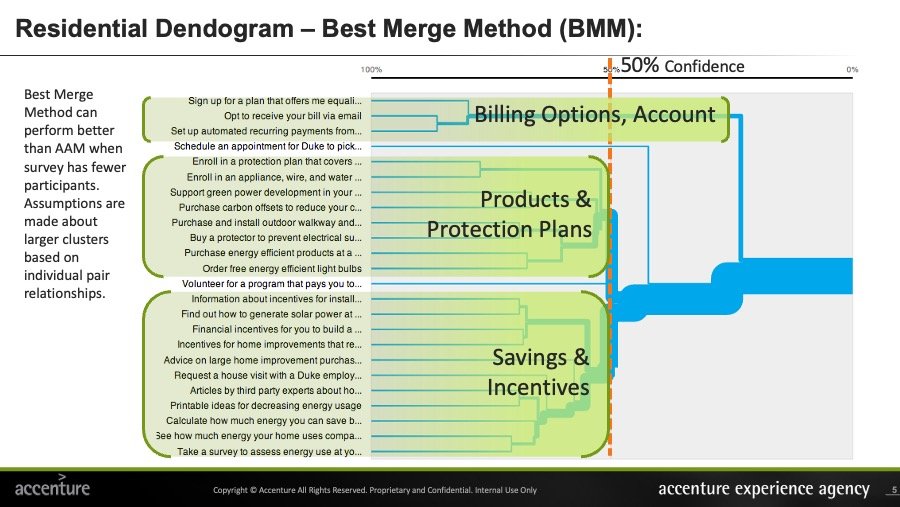
Investigate: Card Sort #1 on how customers group tasks within a mental model (Open)
Validate: Use analysis to build Card Sort #2 with defined categories (Closed)
Use data to define overall Information Architecture for:
Residential
Non-Residential
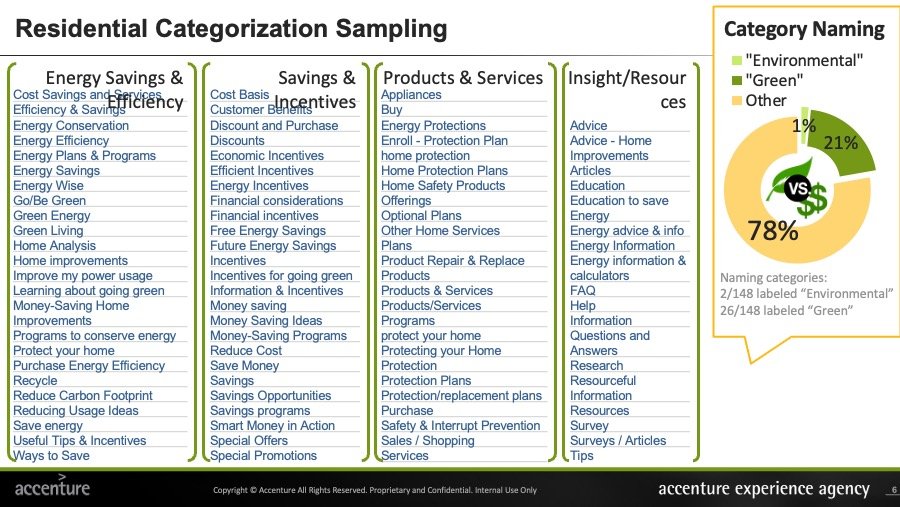
1st Quant: Open Card Sort
21-24 Goal based Cards for open sorting
Open yield: 148 people, Completed: 126 (85%) (22 Abandoned)
Data Used: 78% (2356 / 3024 data points)
User defined (open) naming of each category
Dendrograms and Category Affinities
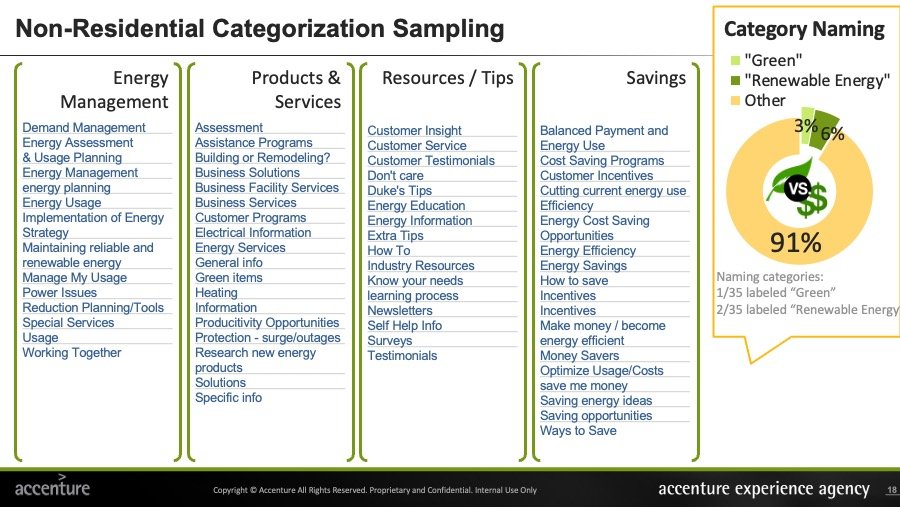
2nd Quant: Closed Card Sort
23-28 Goal based Cards for Closed sorting
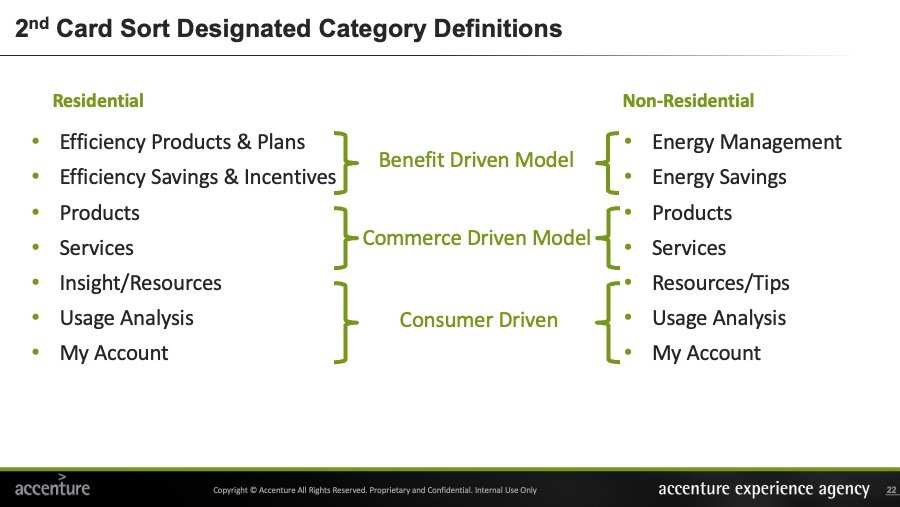
Defined naming of each category
606 people polled, Completed: 363 (59%)
Results
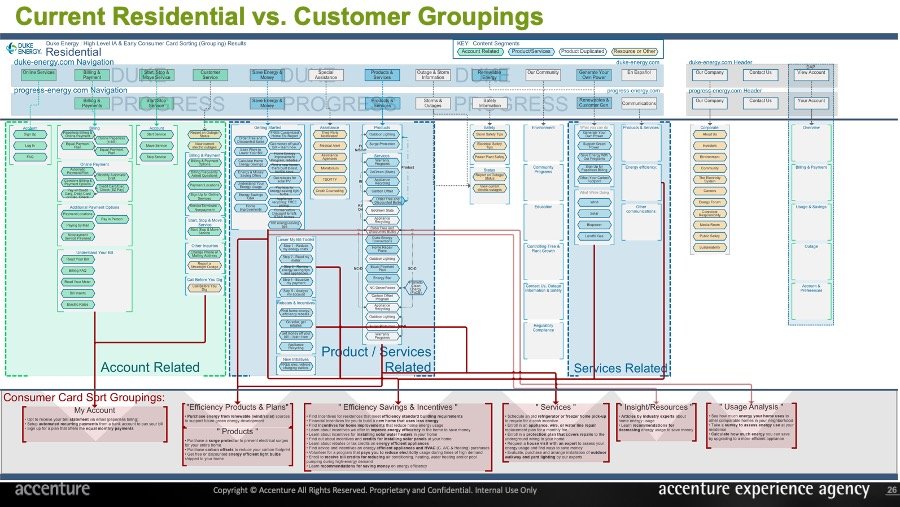
1st Quant: Residential Open Card Sort Analysis
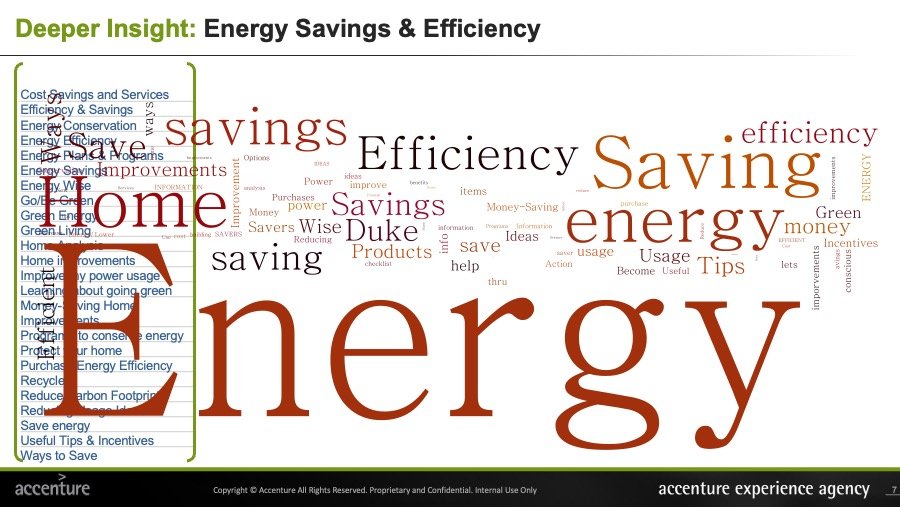
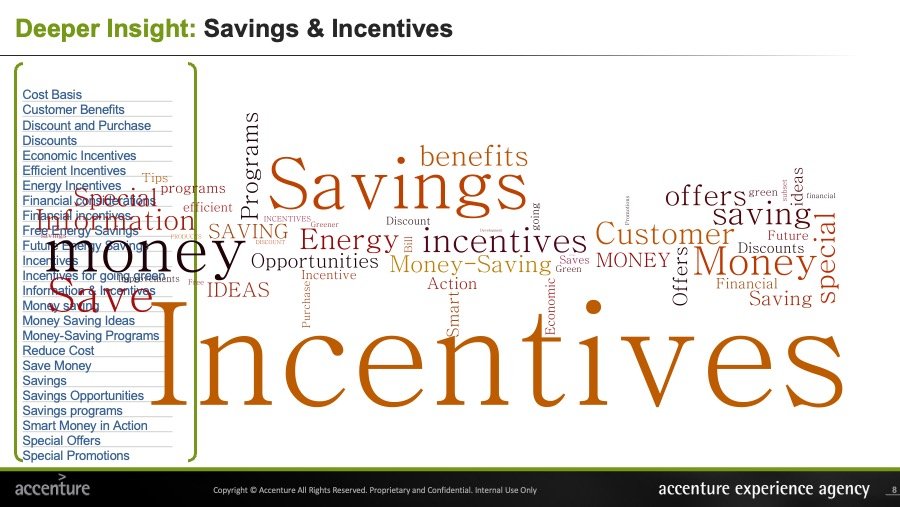
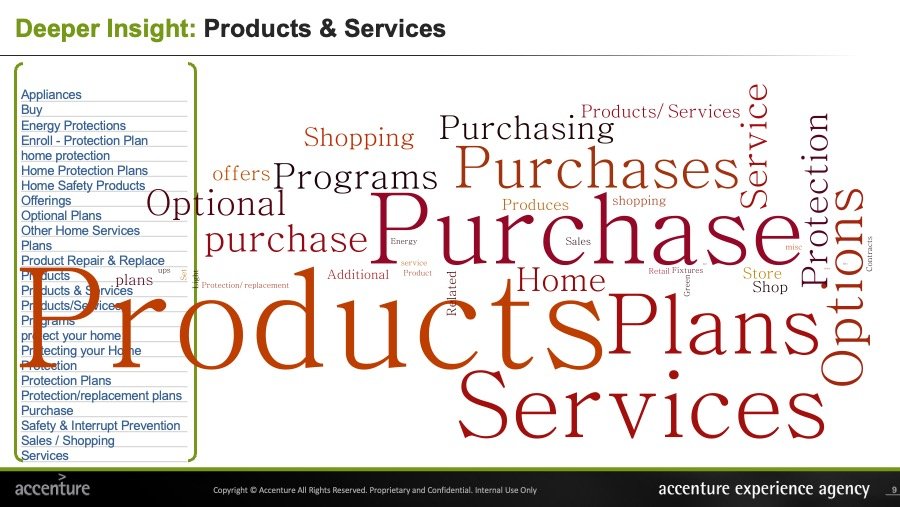
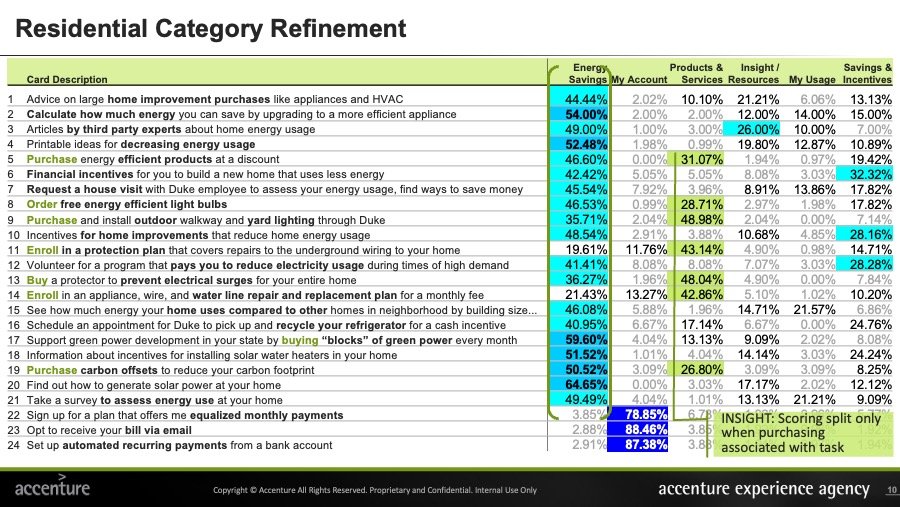
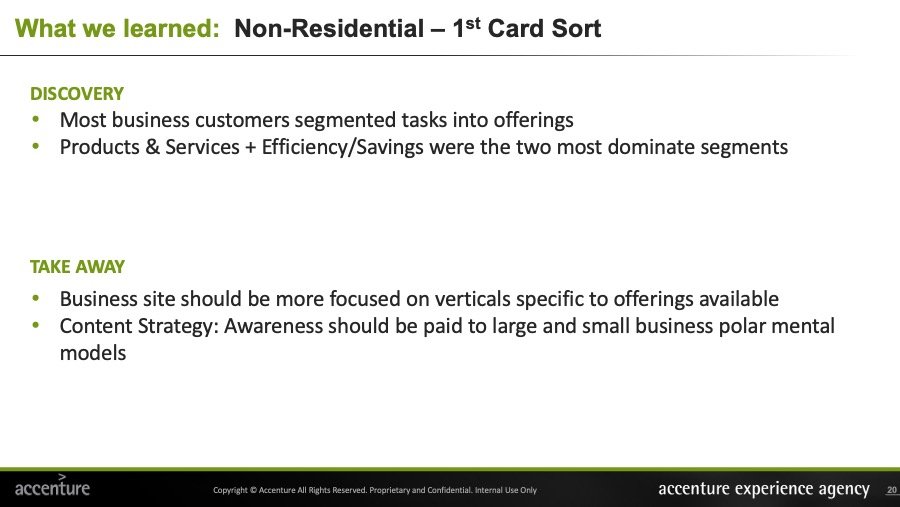
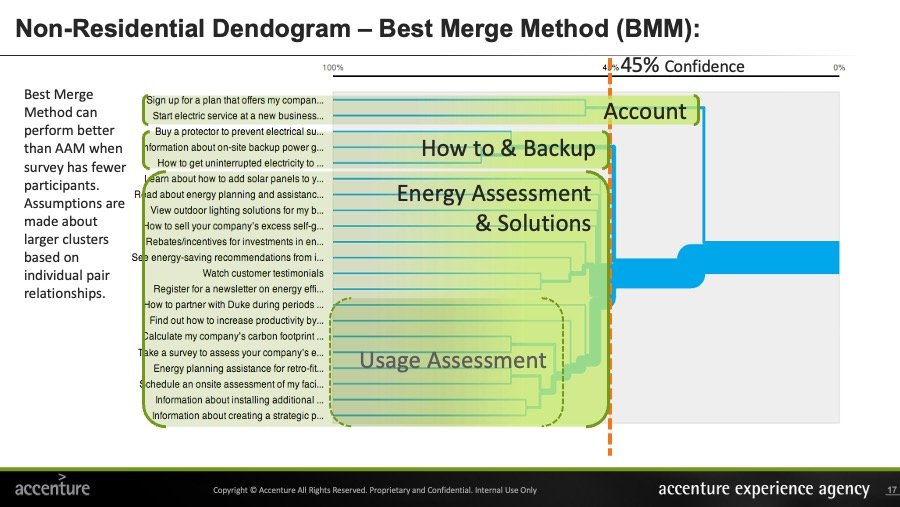
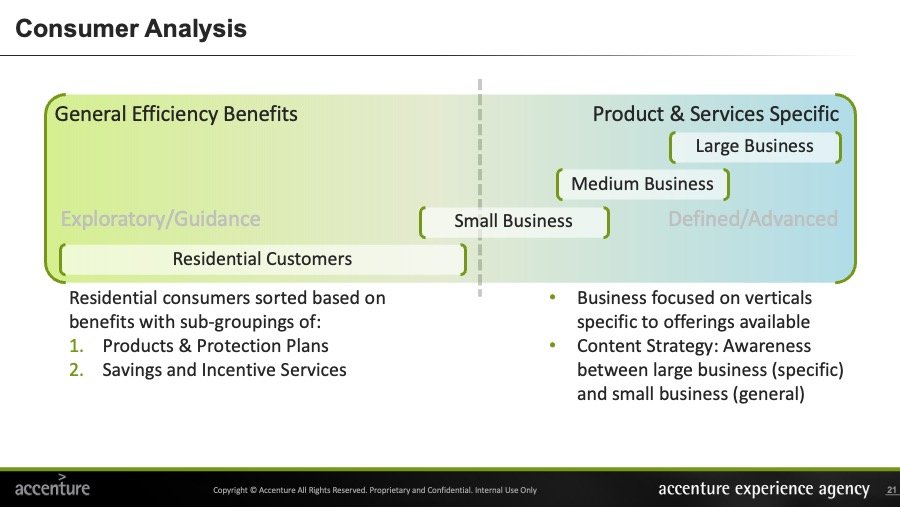
2nd Quant: Non-Res. Closed Card Sort Analysis

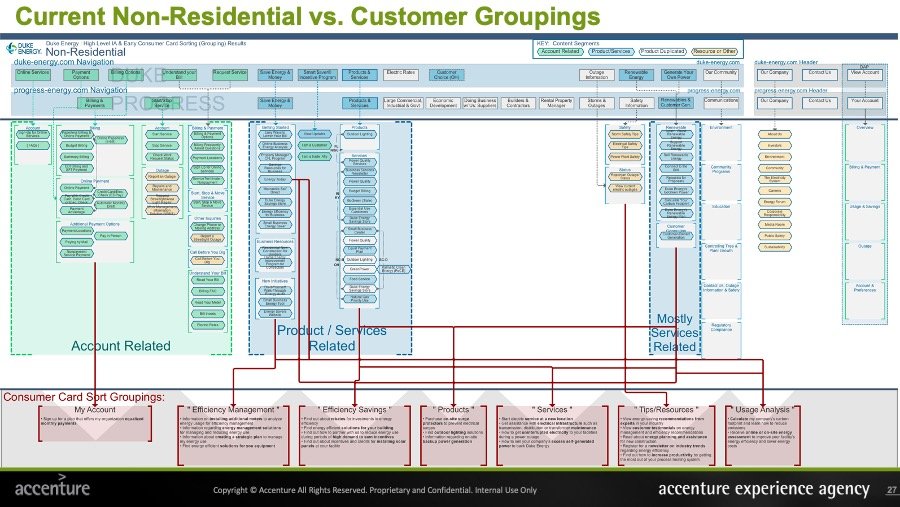
Identified Customer Goals
-
Make it easy, relevant
Don’t force me to continuously navigate through your complex policies and municipal services. Once I identify my region, serve only what is relevant to me. Provide relevant content to my area.
-
Create discovery
Help me discover content to what I am try to solve. Create prompts that allow me to learn more. When I am trying to understand my bill, help me understand how I can also lower it.
-
Provide expert guidance
Provide me greater intelligence in terms that don’t require me to be a scientist or engineer. Help me understand why my bill is higher in the summer so that I’m more informed how to improve my efficiency.
- S. Santos, Group Design Director, Accenture/Fjord Design and Innovation
“Josh demonstrated a mastery of the client issues that needed to be solved as well as a mastery of the methodologies, tools and protocols that were required to deliver. Josh was able to keep the project on task, on budget and deliver high quality output that delighted the client and allowed them to move forward with their redesign effort.”
Delivery
Upon leveraging significant qualitative and quantitative customer research across various states, a unified architecture was created based that aligned to how customers and businesses navigated and searched the website. Content assessment and strategy were aligned to the experience.


